Contents
How it works
General
-
Load samples from WAV.
-
Resample to a intermediate sample rate: 20800Hz.
-
Get L (interpolation factor) and M (decimation factor) by looking at the greatest common divisor (GCD) between input and output sample rates.
-
Get interpolating lowpass filter inpulse response by window method.
-
Get kaiser window.
-
Sample and window the function
sin(n*cutout)/(n*pi).
-
-
Do the equivalent of:
-
Insertion of L-1 zeros between samples.
-
Filter by doing the convolution with the impulse response.
-
Decimate by M.
-
-
-
Demodulate AM signal to get the APT signal.
- Iterate over samples, get amplitude by looking at current and previous sample, see below.
-
Find the position of the sync frames of the APT signal (the white and black stripes that you can see in the final image).
-
Calculate the cross correlation between a hardcoded sync frame and the APT signal.
-
The peaks of that cross correlation show the locations of the sync frames in the APT signal.
-
-
Map the values of the signal to numbers between 0 and 255.
-
Generate the final image starting a new line on every sync frame.
-
Draw the map overlay.
-
Rotate image if necessary.
About frequency

I made this drawing because I keep forgetting how to represent frequencies. Here you can see the frequency spectrum of some APT signal sampled at 11025Hz, the peak is the AM carrier at 2400Hz, and everything wraps around because we use discrete signals.
Resampling algorithm
I did something like what you can see here but with a easier (and slower) implementation.
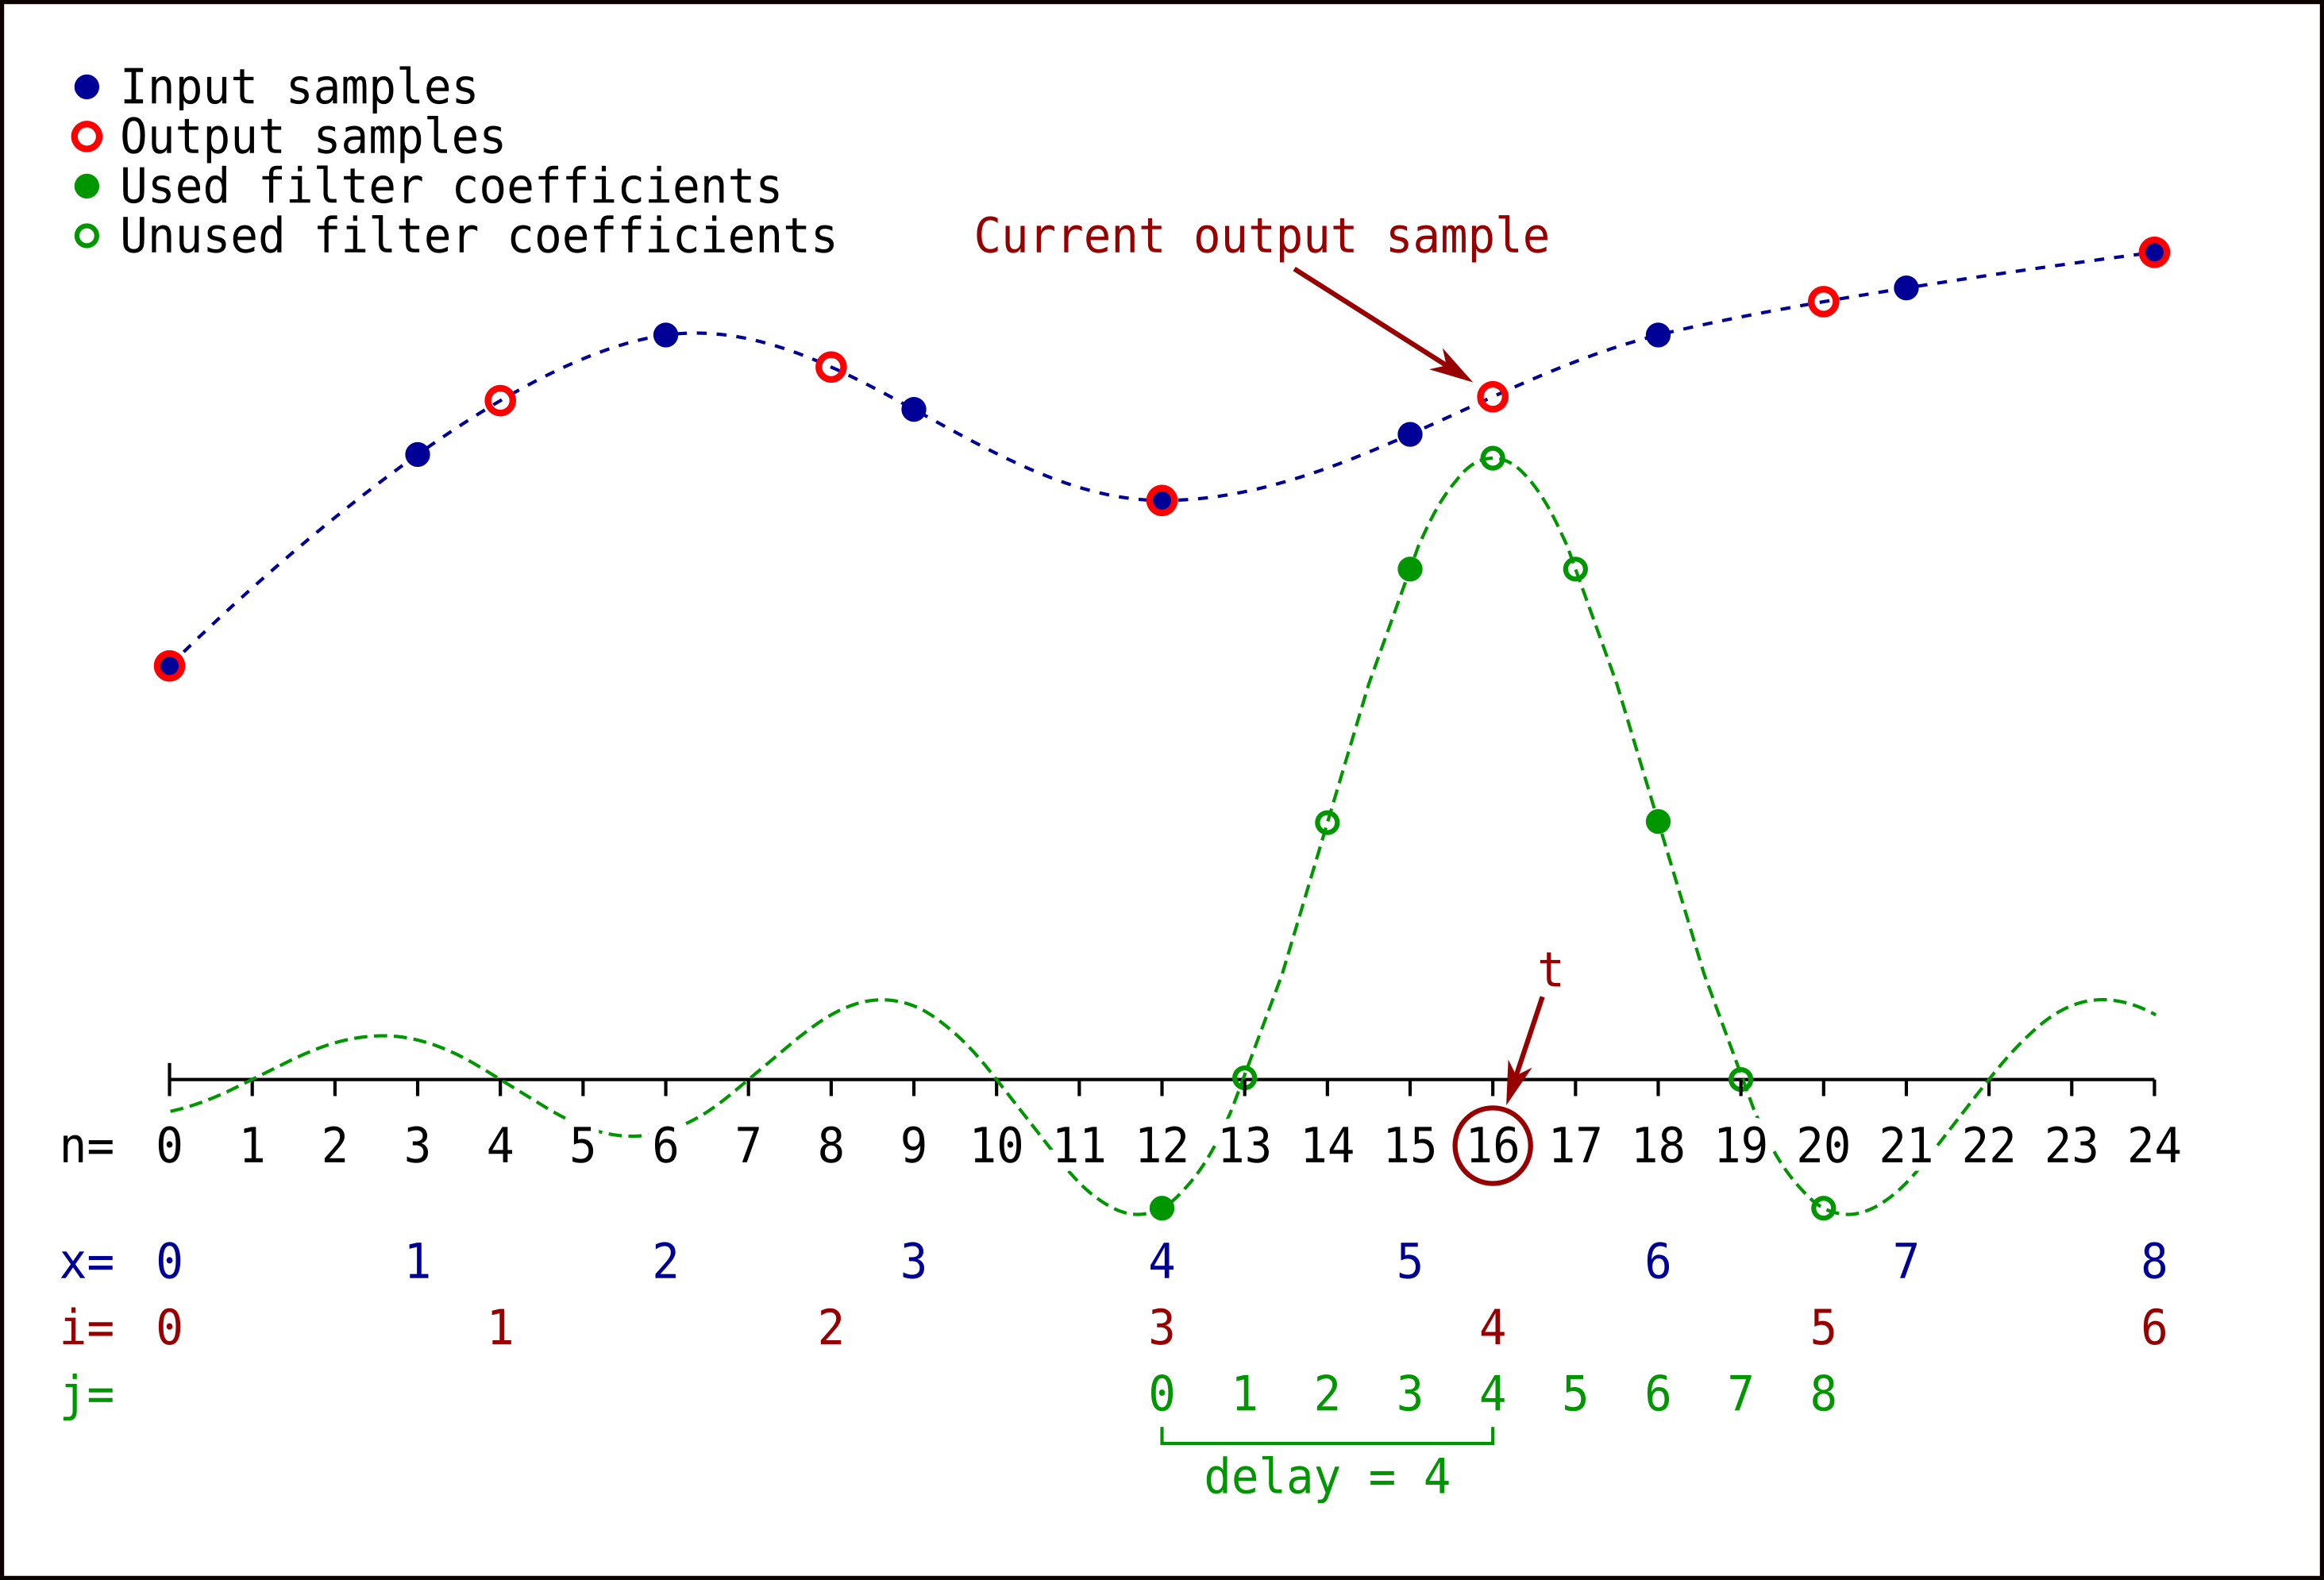
For each output sample, we calculate the sum of the products between input samples and filter coefficients.
AM demodulation
Previously I used a Hilbert filter to get the analytic signal, because the absolute value of the analytic signal is the modulated signal.
Then I found a very fast demodulator implemented on pietern/apt137. For each output sample, you only need the current input sample, the previous one and the carrier frequency:

I couldn’t find the theory behind that method, looks similar to I/Q
demodulation. I was able to reach that final expression (which is used by
pietern/apt137) by hand and I wrote the steps on extra/demodulation.pdf. I
think it only works if the input AM signal is oversampled, maybe that’s why I
can’t find anything about it on the web.
Syncing
I do a cross correlation between the received signal against a sample sync frame (Channel A sync). As a sample sync frame I use the sequence:
.: Black
W: White

[..WW..WW..WW..WW..WW..WW..WW........]
Here you can see some examples.
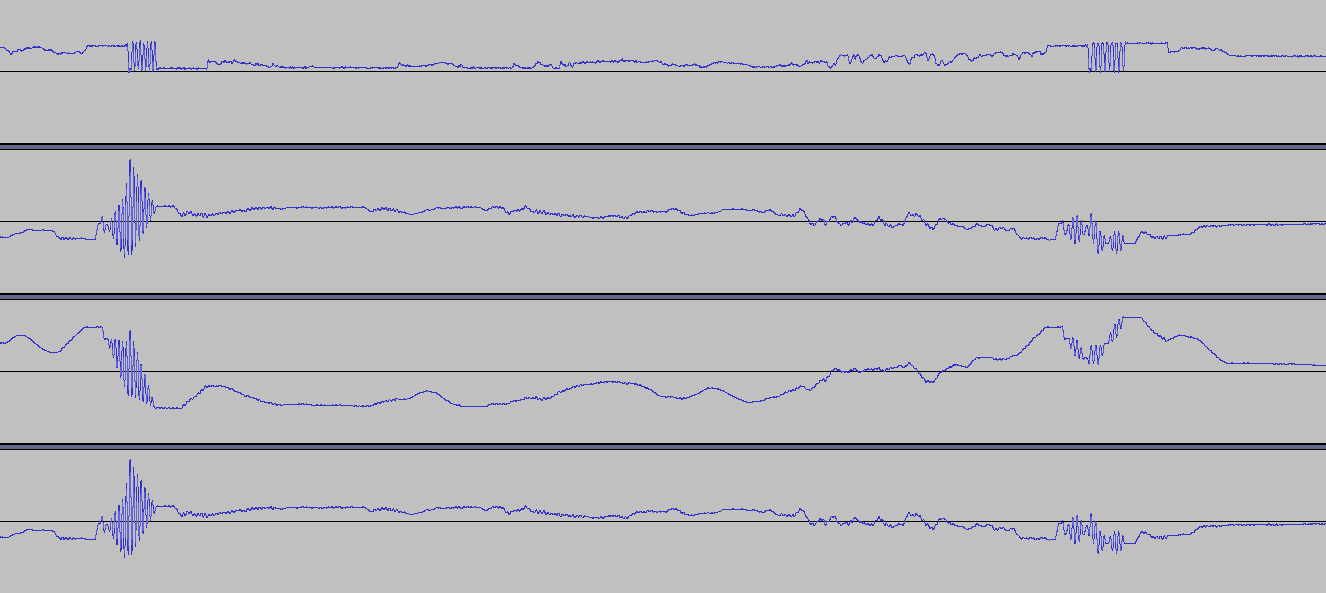
The first signal is the APT signal after AM demodulation, the next three are results of the cross correlation using slightly different samples, they should have peaks where the sync frames are in the original image.
The first one uses on the sample -1 for black and 1 for white. The second
one is wrong, uses 0 for black and 1 for white. The third has the same
sample as the first one but removes the DC component of the APT signal before
doing the cross correlation.
Here you can see a close up of a peak.

Telemetry
Read first below what does the telemetry mean.
The hardest part is to determine where the telemetry wedges are located. Horizontally, the telemetry bands are always on the same place. By looking at a decoded image I get:
- Telemetry A position: 994 pixels
- Telemetry B position: 2034 pixels
- Both have a width of 44 pixels
Now the problem is to know where the telemetry starts vertically, I thought of doing some kind of edge detection but then I realized that we can take advantage of the fact that wedges 1 to 9 are always the same. So I use the following sample:

The variable part contains temperatures and a channel identifier. To determine the start of the telemetry frame I cross correlate the received telemetry band against that sample (excluding wedges 10 to 16). The peaks of the cross correlation show where the frames start.
To avoid noise I do the following:
-
As a sample I use frames 1 to 9 two times.
-
Each telemetry band has a width of 44 pixels, so I calculate the mean of these 44 pixels. Wedges 1 to 14 are the same in both A and B, so we use the mean of 88 pixels.
-
To measure noise I calculate the variance of the same 88 pixels I use to calculate the mean.
-
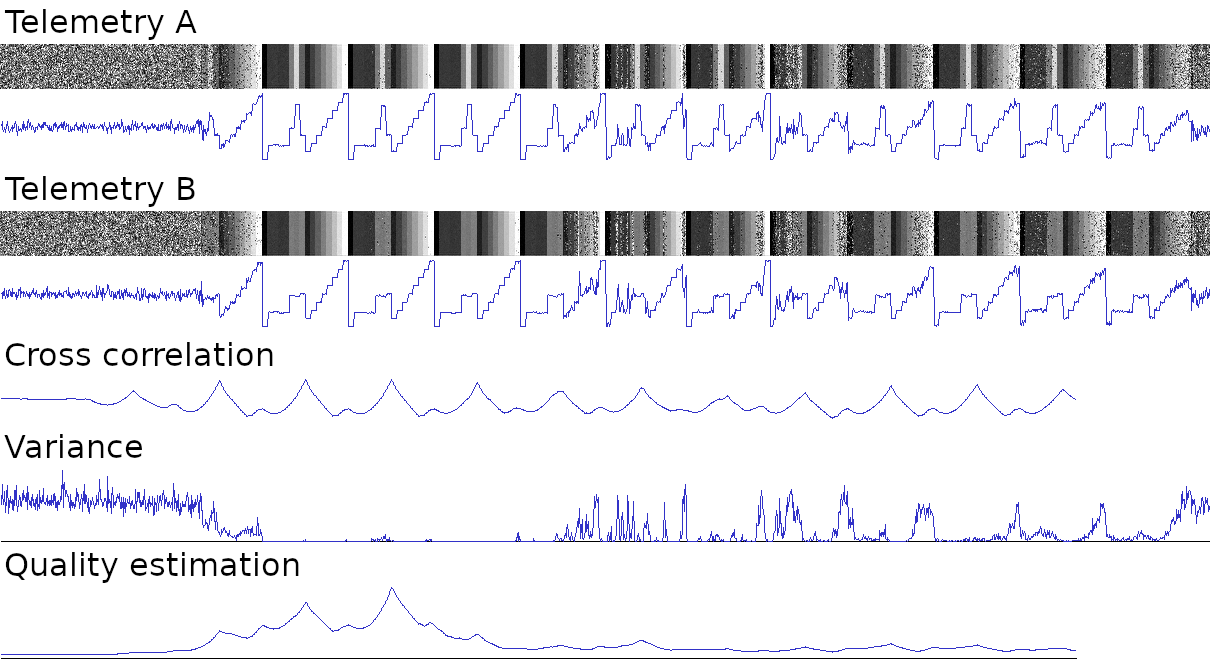
There is more than one telemetry frame on each image, I want to select the best one (less noise). So I divide the cross correlation against the variance to get a quality estimation (actually I’m using the standard deviation instead of variance). The remaining peaks are both starts of frames and low noise frames.
The following image shows an example:
I can also determine the values of the wedges without knowing where they are located vertically, by looking at the values of the pixels on the telemetry band and clustering (e.g. k-means). You can check that doing an histogram on GIMP of the telemetry band:
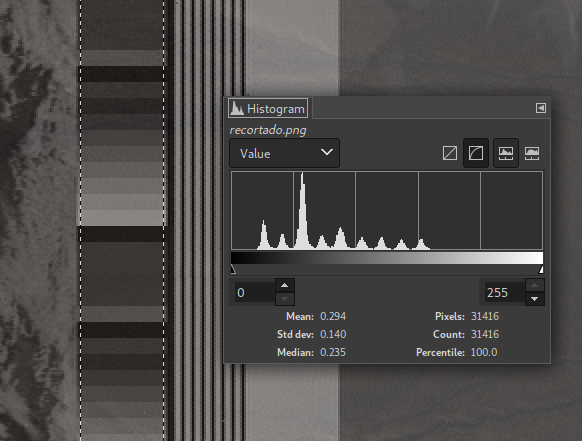
Useful for contrast adjustment but I’m not doing this because I can’t know the value of wedge 16 (channel ID).
Map overlay
It is necessary to know the position of the satellite when the recording was made, so a TLE is loaded and the satellite-rs library is used.
To draw the map, a shapefile (.shp) is loaded with the coordinates of every
line we need to draw over the image. The coordinates are
(latitude, longitude) pairs and we need to convert them to (X, Y) image
coordinates. Now I’m going to try to explain this conversion.
I never tried to do math over a sphere before, I made lots of mistakes and I managed to make it work but I’m not sure if my calculations are good approximaions. It is very easy to make mistakes assuming things that happen in euclidean geometry (e.g. here triangles do not add up to 180°). Looks like the equivalent of a straight line is a geodesic, and I found these Napier’s rules for right spherical triangles (triangles of geodesic lines with a 90° angle).
See the drawing for an example of a northbound image taken near the north pole. The orange line is a coastline to be drawn.
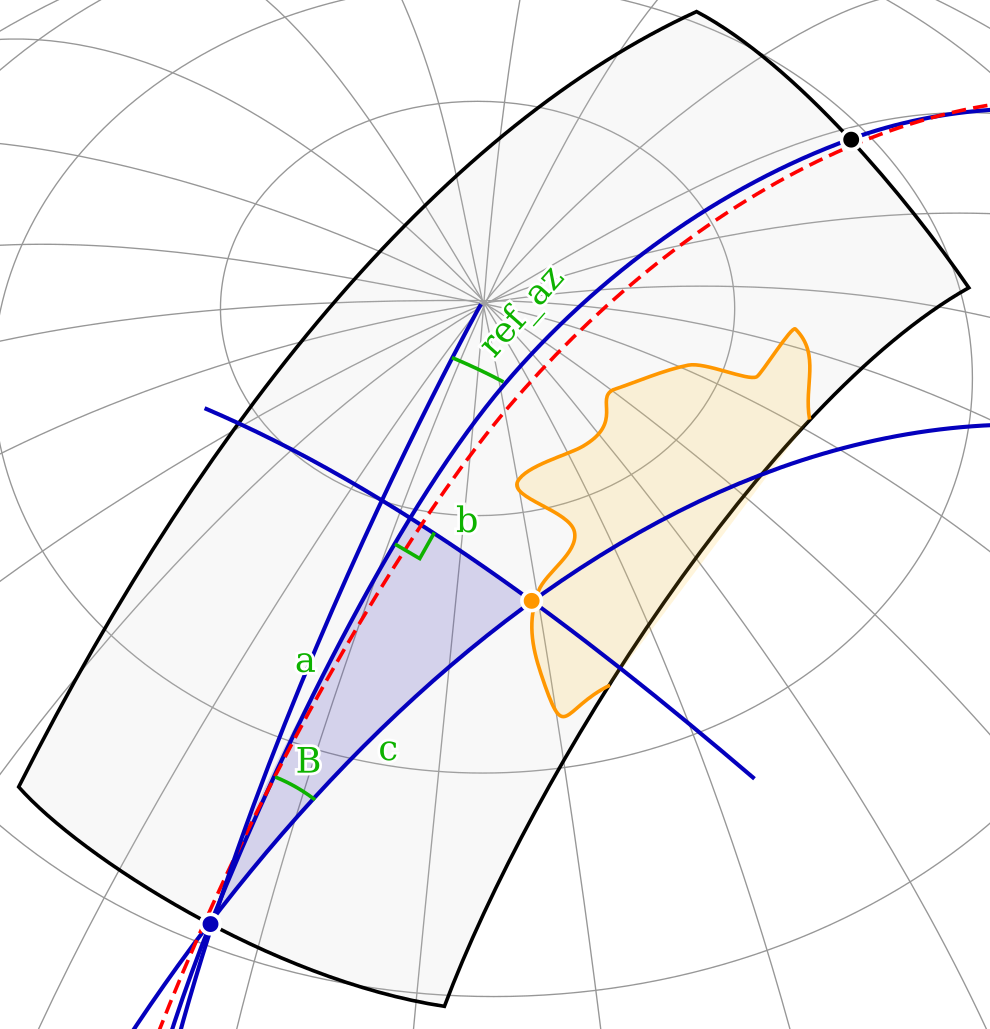
The blue lines and meridians (gray lines that go through the north pole) are geodesics. The parallels (gray lines othogonal to meridians) and the red satellite track are not geodesics (so I can’t solve triangles with them).
The red satellite track is almost a geodesic, so I just use the geodesic that
goes through the start and end points as an equivalent of the image Y axis.
The X axis is equivalent to another perpendicular geodesic.
If we want to convert the orange point from (latitude, longitude) to (X, Y),
we can imagine an a-b-c triangle. We took the coordinates of the orange point
from the shapefile and the coordinates of the blue point from the satellite
position. Thanks to some functions made by
Alexander Barth,
it is easy to calculate the distance c and the angle B.
Using the
Napier’s rules for right spherical triangles
from Wikipedia we can get the lengths a
and b which are equivalent to Y and X in image coordinates. A conversion
from degrees to pixels is needed, it depends on the resolution of the image.
At this point, there is a slight offset on the X axis because we used the blue geodesic instead of the red satellite track. The fix I found is to:
-
We already calculated
Y, and we know that the satellite sends two lines per second. So we can take the start time and addY/2seconds to it to calculate the true position of the satellite at the moment it crossed thebline. -
If we convert the position of the satellite at that moment to pixels (using the procedure above), we are going to get the same
Y, butXwill be a small number. That small number is the offset we have to use to do the correction.
Histogram equalization
It is a standard histogram equalization. In false-color images, the RGB channels are converted to the Lab color space and the equalization is made only over the L (brightness) channel leaving colors unchanged.
False color
The color is determined solely from the channel A and channel B brightness, mapping their values as indicated by a palette image. The size of the palette image is 256x256, where the X axis is the value of channel A and the Y axis is the value of channel B.
For example: if for a certain pixel, the brightness values (that range from 0 to 255) are 123 for channel A and 204 for channel B, then the pixel will be set to the color found on the palette image at coordinates X=123, Y=204.
The sliders in the GUI will modify the brightness values before they are used to look-up the palette. For example, by moving the first two sliders, the channel A values originally in the range 0-255 can be mapped to a range of 30-189. This will produce that the colors obtained from the palette will be different, and this can be used to manually fix when ground is confused with water.
Here you can find more information about the included palettes. Open the palettes with an image editor to better understand them.
About APT images
Modulation
-
The signal is modulated first on AM and then on FM.
-
FM frequencies:
-
NOAA 15: 137.62MHz.
-
NOAA 18: 137.9125MHz.
-
NOAA 19: 137.1MHz.
-
-
AM carrier: 2400Hz.
Pixels
-
8 bits/pixel.
-
The signal amplitude represents the brightness of each pixel.
-
Two lines per second, 4160 pixels per second.
-
2080 pixels per line, each channel has 909 useful pixels per line.
Format
There are different imaging sensors, named as Channel 1, 2, 3A, 3B, 4 and 5. Two of them are chosen by the satellite operators to be shown on two portions of the image, named Channel A and B.
-
Channel A: On daylight generally has images from the Channel 2 sensor (almost visible light), at night generally has Channel 3A (infrared).
-
Channel B: Generally always has Channel 4 (infrared).
Each line has:
-
Channel A sync: 1040Hz square wave, seven cycles. This train of pulses appears in the image as seven vertical black and white stripes, has slightly narrower white stripes than the Channel B sync.
-
Channel A space: Scan of deep space with the Channel A sensor, on the image looks like a wide black or white vertical bar, see below why. Once each minute, the spacecraft clock inserts minute markers into this portion of the image. These minute markers appear as thin, black or white horizontal lines to provide a 60 second time reference in the image.
-
Channel A image: Earth as seen from the Channel A sensor.
-
Channel A telemetry: Looks like gray-scale horizontal bars. See below.
-
Channel B sync: Seven pulses, the frequency is 832 pulses per second. This train of pulses appears in the image as seven vertical black and white stripes, has slightly wider white stripes than the Channel A sync.
-
Channel B space: Scan of deep space with the Channel B sensor, on the image looks like a wide black or white vertical bar, see below why. Once each minute, the spacecraft clock inserts minute markers into this portion of the image. These minute markers appear as thin, black or white horizontal lines to provide a 60 second time reference in the image.
-
Channel B image: Earth as seen from the Channel B sensor.
-
Channel A telemetry: Looks like gray-scale horizontal bars. See below.
The Channel A sync frame and the Channel B sync make up the distinctive “tick-tock” sound on the received APT audio signal.
Both Channel A space and Channel B space have a scan of deep space using the same sensor used to image earth. If the sensor is sensible to visible light this part looks black (Channel 2 and I guess Channel 1 too). The infrared channels represent cold as white, so this part of the image looks white instead (Channel 3A, 4 and I guess that 3B and 5 too).
The telemetry bands have calibration data and information about the current channel being transmitted. Bars/wedges 1 to 9 are used for contrast adjustment and are fixed, wedges 10 to 16 can change because they show temperatures used for infrared images calibration.
Telemetry wedges
-
Value: 31/255.
-
Value: 63/255.
-
Value: 95/255.
-
Value: 127/255.
-
Value: 159/255.
-
Value: 191/255.
-
Value: 224/255.
-
Value: 255/255.
-
Value: 0/255.
-
Black body radiator termometer #1.
-
Black body radiator termometer #2.
-
Black body radiator termometer #3.
-
Black body radiator termometer #4.
-
Patch temperature.
-
Back scan: Temperature of the black body radiator observed by the imaging sensor
-
Channel identification: When compared to the values of the wedges 1 to 9 you can determine which channel is being used. Both this wedge and the back scan wedge is different on Channel A and B. See the list of channels below.
Channels
Channel A is the left part of the image, channel B is the right one. Each one can show any of the following sensors (also called channels).
-
1: Visible. Equivalent wedge: 1. Wavelength: 0.58µm - 0.68µm. Daytime cloud and surface mapping.
-
2: Near-infrared. Equivalent wedge: 2. Wavelength: 0.725 - 1.00µm. Land-water boundaries.
-
3A: Infrared. Equivalent wedge: 3. Wavelength: 1.58µm - 1.64µm. Snow and ice detection.
-
3B: Infrared. Equivalent wedge: 6. Wavelength: 3.55µm - 3.93µm. Night cloud mapping, sea surface temperature.
-
4: Infrared. Equivalent wedge: 4. Wavelength: 10.30µm - 11.30µm. Night cloud mapping, sea surface temperature.
-
5: Infrared. Equivalent wedge: 5. Wavelength: 11.50µm - 12.50µm. Sea surface temperature.
References
-
NOAA Signal Decoding And Image Processing Using GNU-Radio: About the APT image format.
-
Digital Envelope Detection: The Good, the Bad, and the Ugly: Lists some AM demodulation methods. I’m not using any of these anyway.
-
Hilbert Transform Design Example: How to get the analytic signal if using Hilbert filter demodulation.
-
Kaiser window approximation on StackOverflow: I took the Bessel function from there (see the infinite sum), but I think that it’s slightly wrong, according to this that minus sign should not be there. I’m comparing my implementation (without the minus sign) in my tests with
rgsl::bessel::I0and everything works well, that’s not the case when I add that minus sign. I suggested an edit on the StackOverflow post and the author said me that I’m wrong, so now I’m confused. -
zacstewart/apt-decoder: Easy to understand NOAA APT decoder.
-
pietern/apt137: The fastest NOAA APT decoder, I took the AM demodulation method from there.
-
APT on sigidwiki.com: More about the APT format.
-
User’s Guide for Building and Operating Environmental Satellite Receiving Stations: About the APT format and decoding.
-
Advanced Very High Resolution Radiometer: About the image sensor.